
Volver al registro de cambios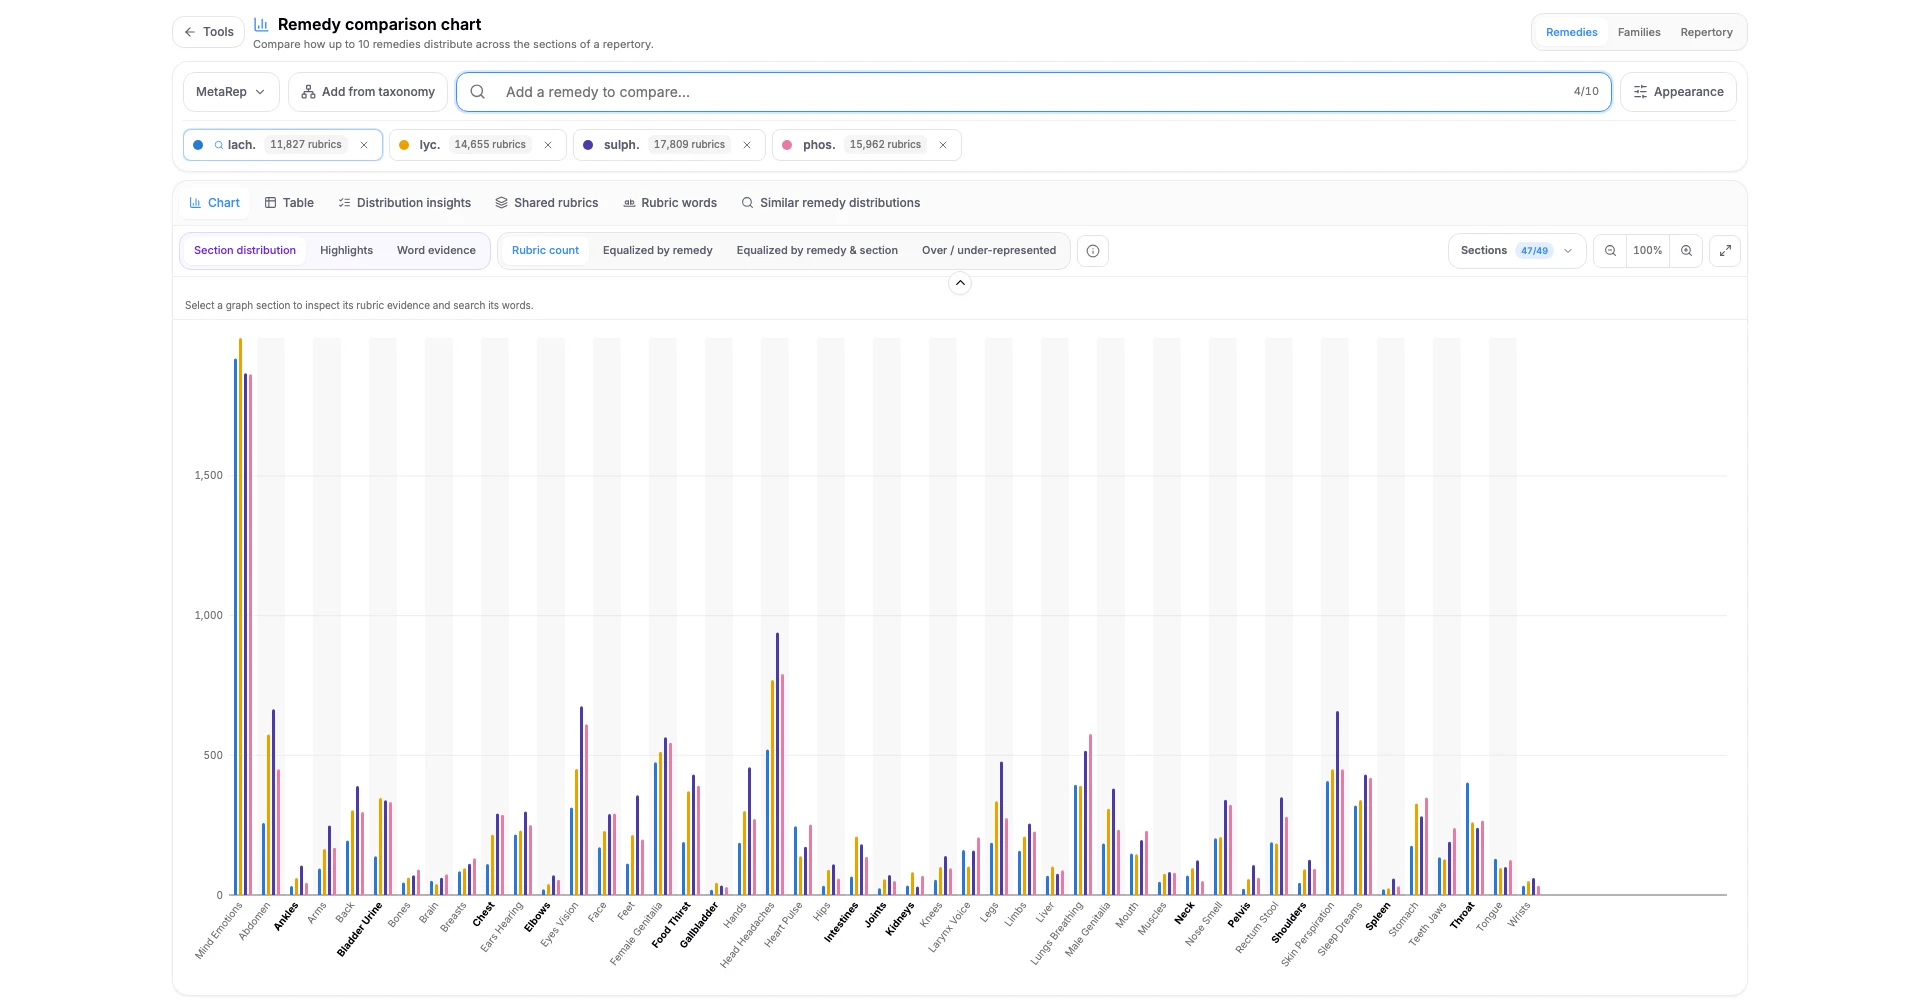
Actualización de función31 jul, 2026Pro
Comparación de remedios
Grafica cómo se distribuyen los remedios — o familias enteras — en un repertorio, y luego lee las rúbricas detrás de cada diferencia.
Diez remedios, cada sección
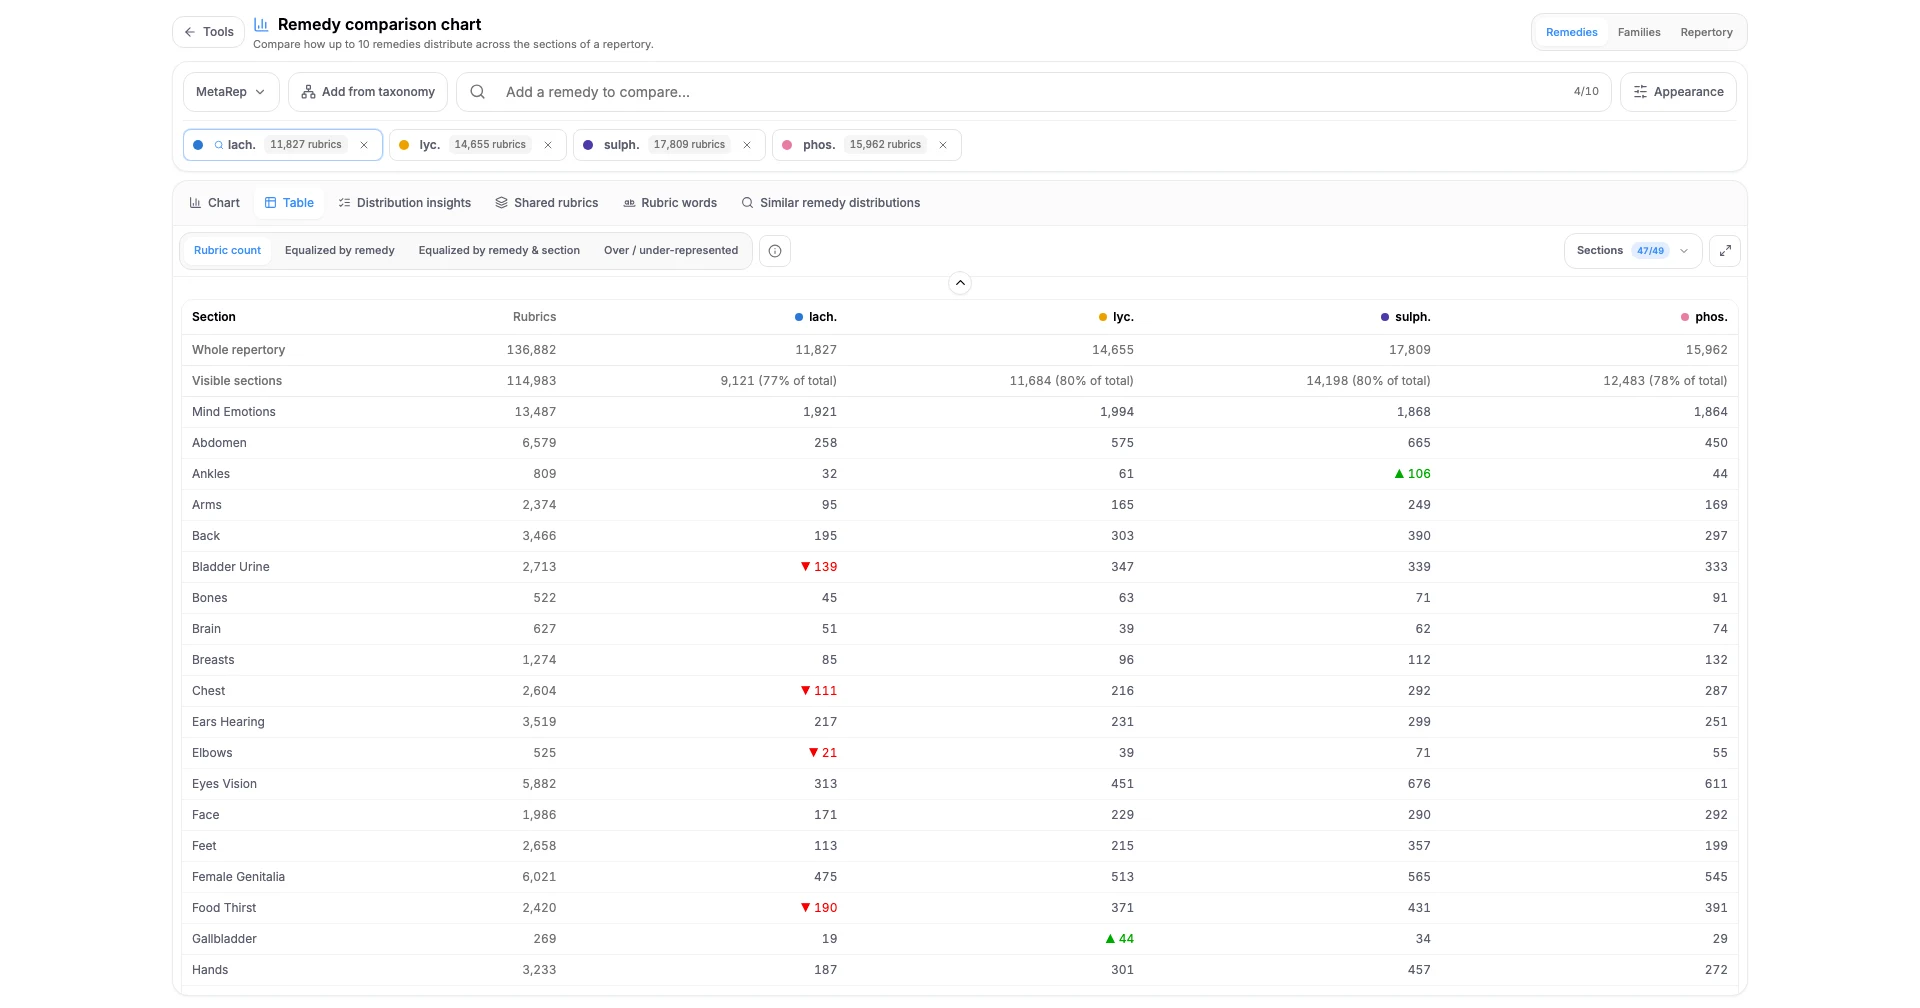
Añade hasta diez remedios y coloca sus perfiles lado a lado en todo el repertorio, como gráfico o como tabla.
- Compara los recuentos de rúbricas sección por sección.
- Normaliza por remedio para que un remedio pequeño pueda leerse junto a un policresto.
- Normaliza por remedio y sección para sacar de la imagen la propia forma del repertorio.
- Cambia a sobrerrepresentado e infrarrepresentado para ver dónde destaca realmente un remedio.
- Reduce el alcance de la sección, o abre una sección para inspeccionar las rúbricas detrás de una barra.
Compara familias enteras
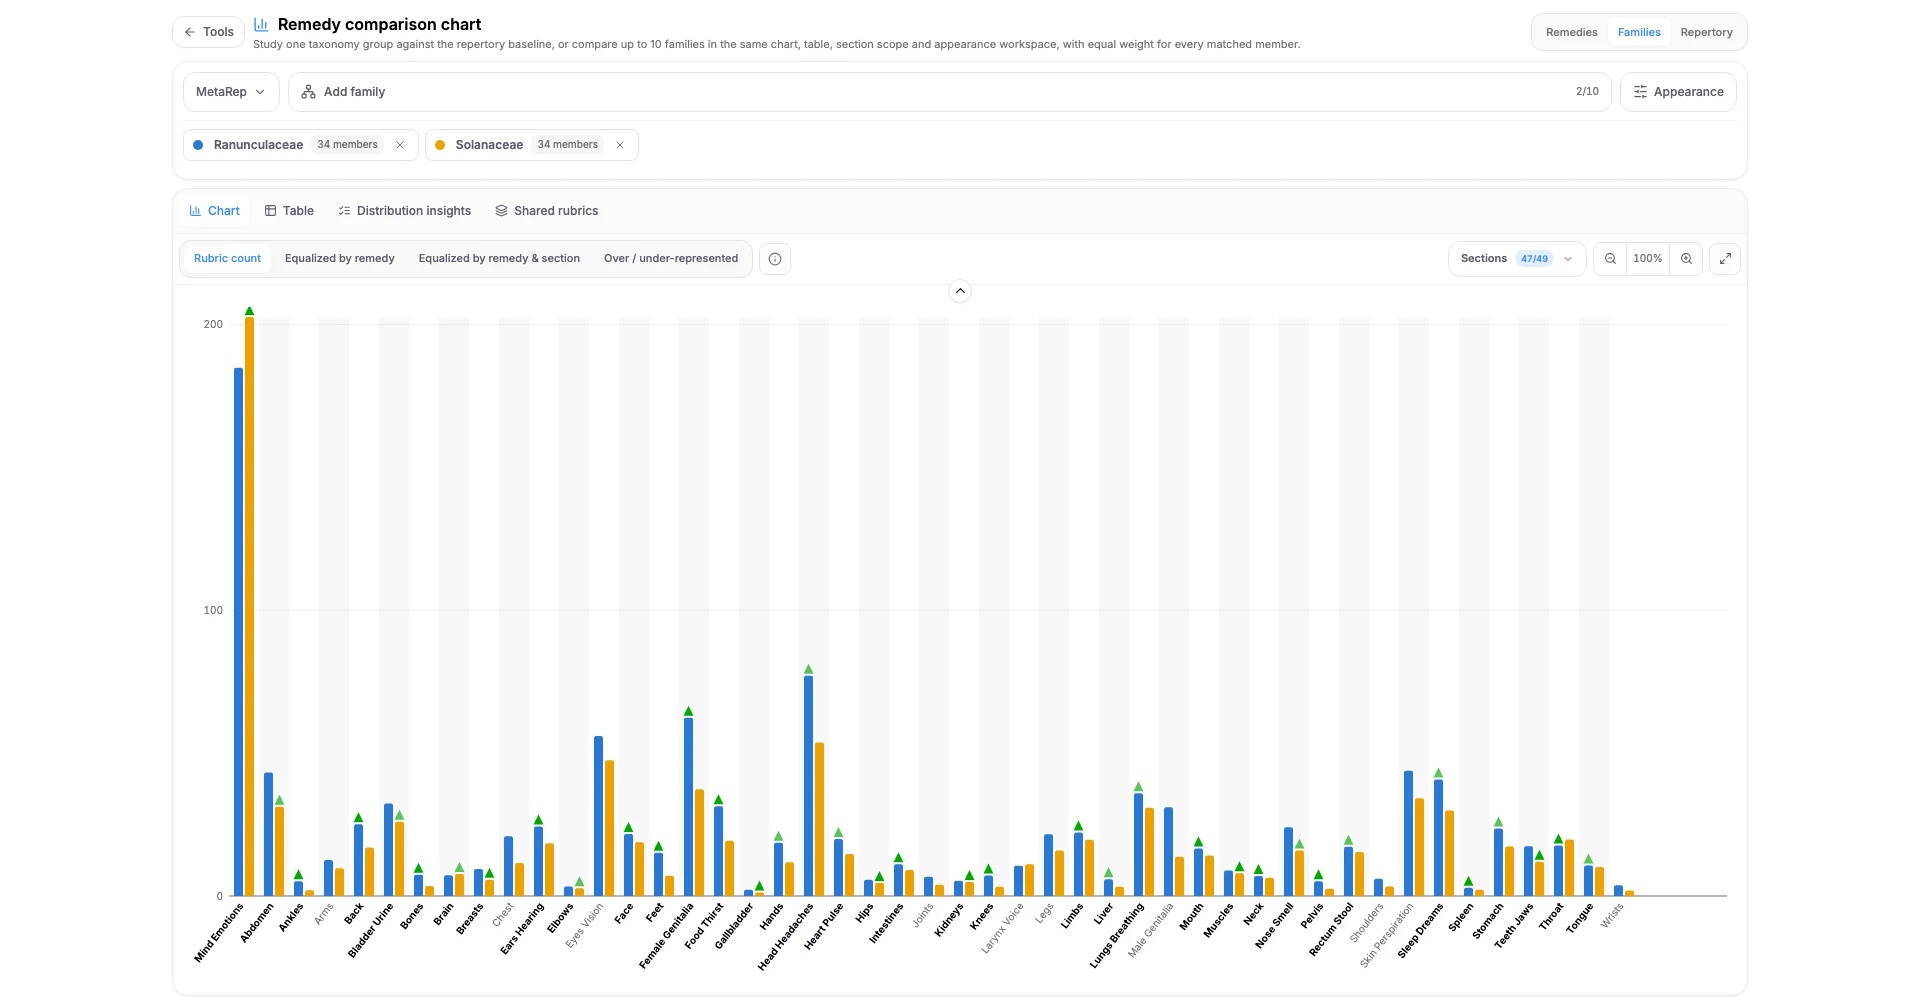
Cambia el tema de remedios a familias y estudia un grupo taxonómico frente a la referencia del repertorio — o hasta diez grupos entre sí.
- Elige un grupo de la taxonomía Estándar o de Scholten.
- Cada miembro coincidente cuenta por igual, por lo que un único remedio grande no puede sostener a una familia.
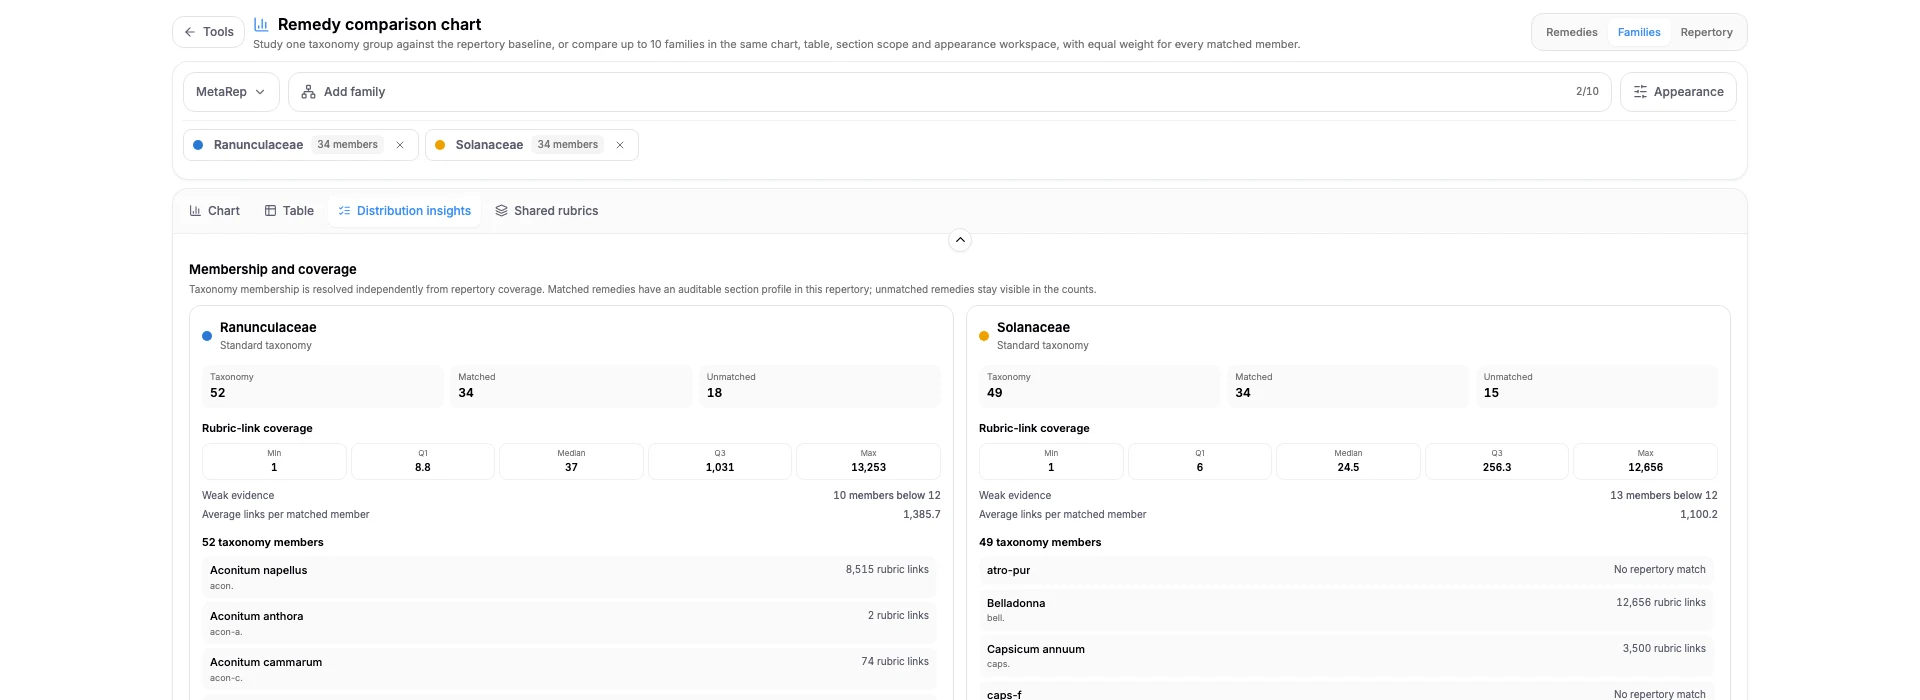
- La membresía y la cobertura muestran cuántos miembros de la taxonomía coincidieron en este repertorio y cuántos no.
- Los avisos señalan evidencia débil y definiciones superpuestas antes de que interpretes nada en el gráfico.
- La prevalencia de rúbricas características separa lo que dos familias comparten de lo que pertenece solo a una de ellas.
El repertorio en sí — y las rúbricas detrás de él
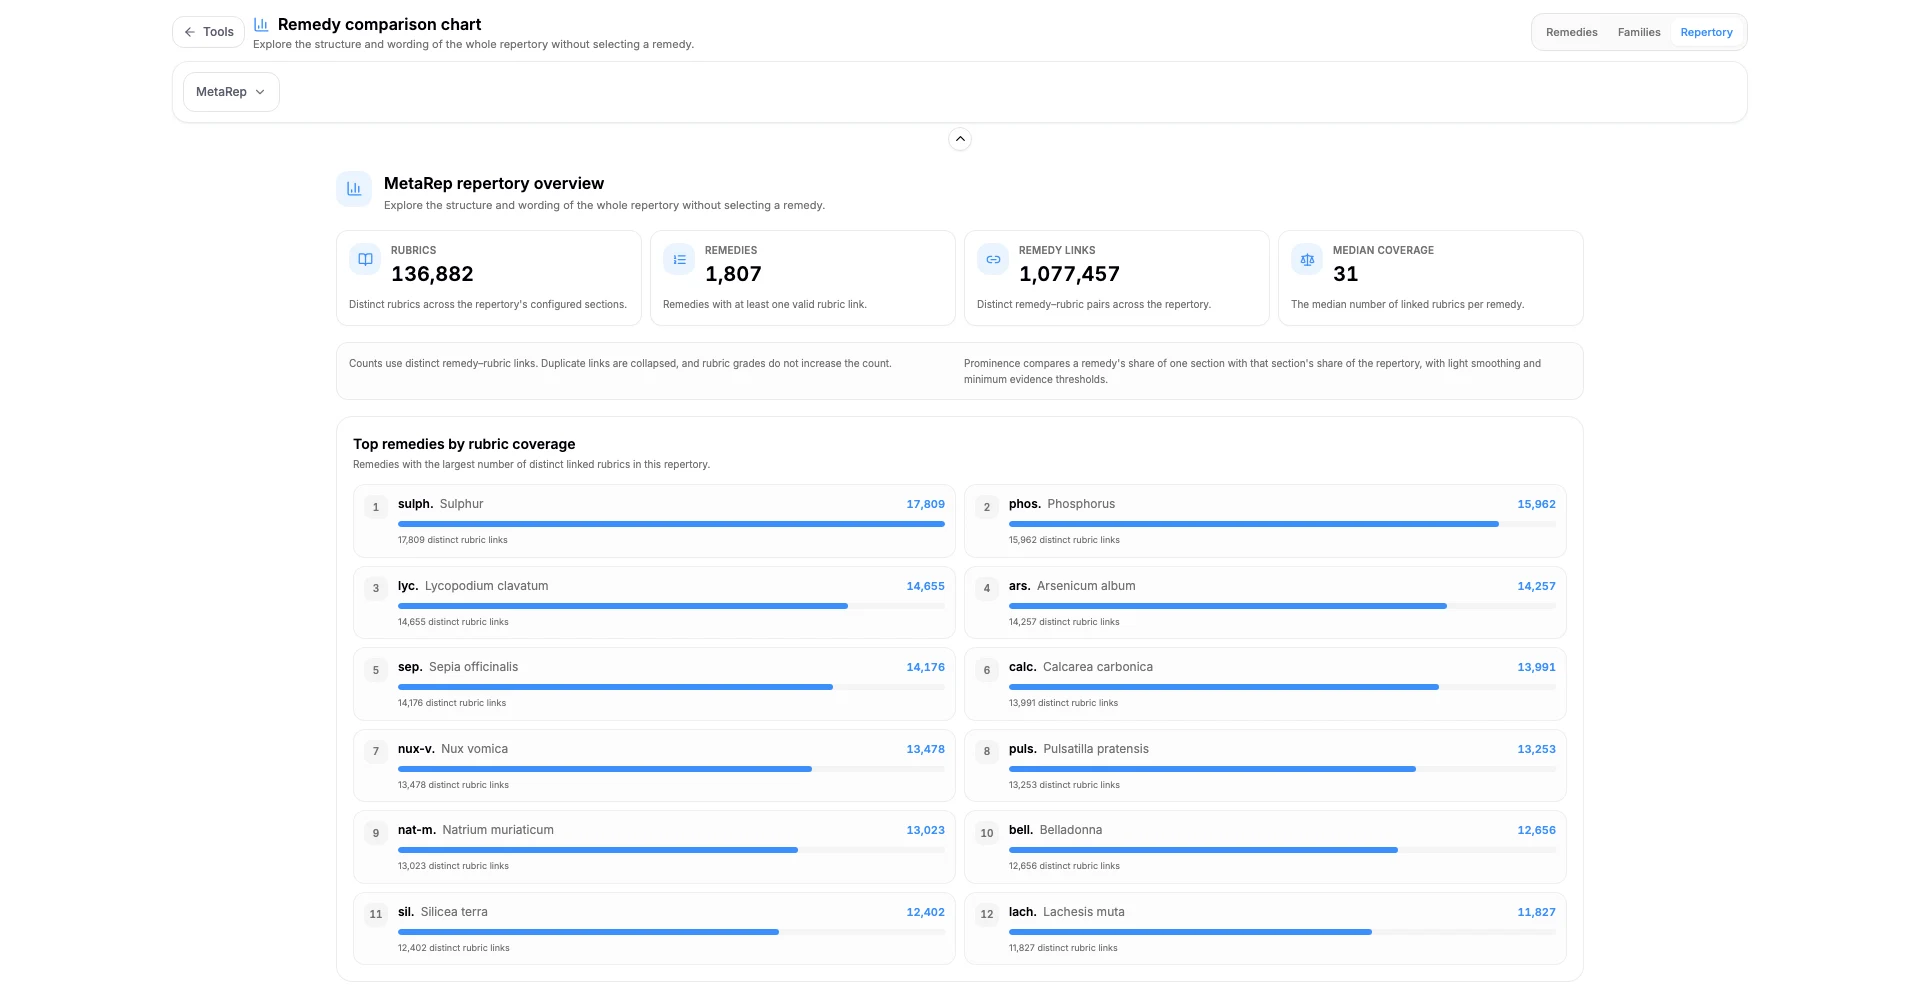
Antes de haber elegido algo, mira el repertorio completo. Después, lee las rúbricas reales en lugar de las barras.
- Estadísticas de todo el repertorio: rúbricas, remedios, enlaces de remedios y cobertura mediana.
- Principales remedios por cobertura de rúbricas, y los remedios principales de cada sección.
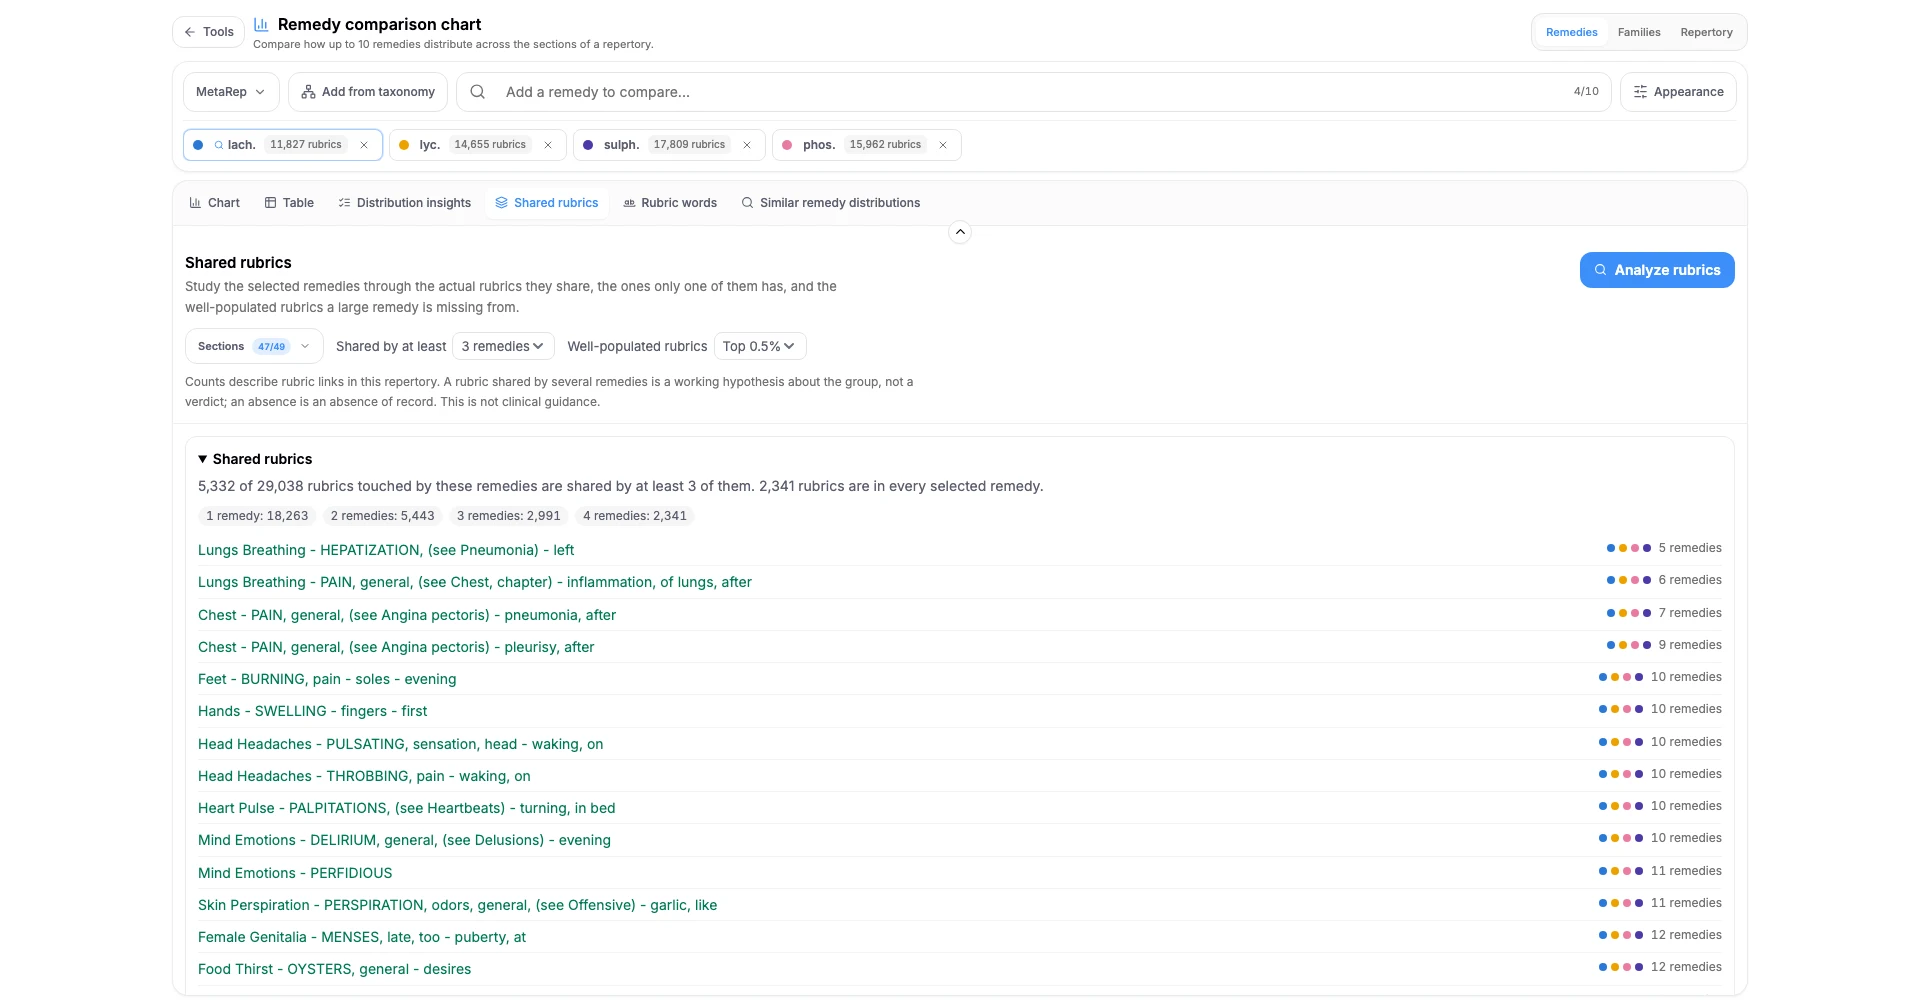
- Las rúbricas compartidas enumeran lo que tienen en común los remedios seleccionados y cuántos de ellos comparten cada una.
- Ve las rúbricas que pertenecen solo a uno de tus remedios.
- Ve dónde falta un remedio grande en rúbricas bien pobladas — una ausencia de registro, no un veredicto.
Compara remedios en Similia
El espacio de comparación de remedios forma parte de Similia Pro.